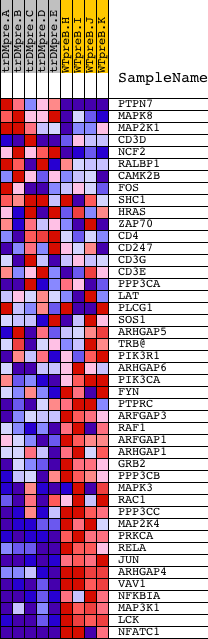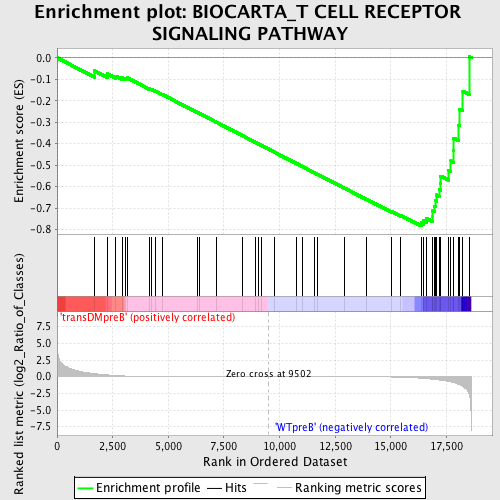
Profile of the Running ES Score & Positions of GeneSet Members on the Rank Ordered List
| Dataset | Set_04_transDMpreB_versus_WTpreB.phenotype_transDMpreB_versus_WTpreB.cls #transDMpreB_versus_WTpreB |
| Phenotype | phenotype_transDMpreB_versus_WTpreB.cls#transDMpreB_versus_WTpreB |
| Upregulated in class | WTpreB |
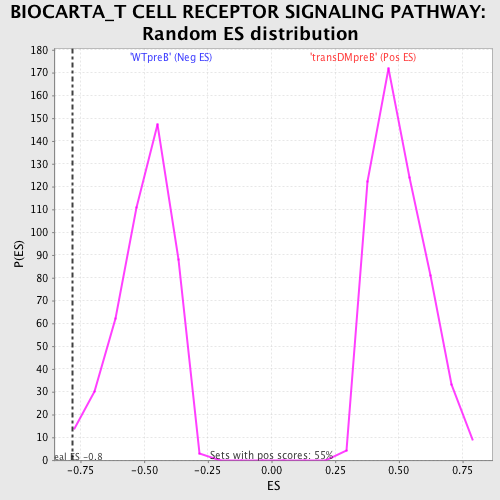
| GeneSet | BIOCARTA_T CELL RECEPTOR SIGNALING PATHWAY |
| Enrichment Score (ES) | -0.7831659 |
| Normalized Enrichment Score (NES) | -1.5821393 |
| Nominal p-value | 0.0043956046 |
| FDR q-value | 0.103084296 |
| FWER p-Value | 0.569 |
| PROBE | DESCRIPTION (from dataset) | GENE SYMBOL | GENE_TITLE | RANK IN GENE LIST | RANK METRIC SCORE | RUNNING ES | CORE ENRICHMENT | |
|---|---|---|---|---|---|---|---|---|
| 1 | PTPN7 | 11500 | 1675 | 0.461 | -0.0608 | No | ||
| 2 | MAPK8 | 6459 | 2251 | 0.267 | -0.0748 | No | ||
| 3 | MAP2K1 | 19082 | 2640 | 0.166 | -0.0851 | No | ||
| 4 | CD3D | 19473 | 2923 | 0.118 | -0.0928 | No | ||
| 5 | NCF2 | 14098 5151 9446 | 3067 | 0.097 | -0.0943 | No | ||
| 6 | RALBP1 | 9725 | 3152 | 0.088 | -0.0932 | No | ||
| 7 | CAMK2B | 20536 | 4149 | 0.033 | -0.1447 | No | ||
| 8 | FOS | 21202 | 4235 | 0.031 | -0.1473 | No | ||
| 9 | SHC1 | 9813 9812 5430 | 4437 | 0.027 | -0.1564 | No | ||
| 10 | HRAS | 4868 | 4722 | 0.022 | -0.1703 | No | ||
| 11 | ZAP70 | 14271 4042 | 6326 | 0.009 | -0.2560 | No | ||
| 12 | CD4 | 16999 | 6414 | 0.009 | -0.2601 | No | ||
| 13 | CD247 | 4498 8715 | 7182 | 0.006 | -0.3010 | No | ||
| 14 | CD3G | 19139 | 8314 | 0.003 | -0.3618 | No | ||
| 15 | CD3E | 8714 | 8903 | 0.001 | -0.3933 | No | ||
| 16 | PPP3CA | 1863 5284 | 9030 | 0.001 | -0.4000 | No | ||
| 17 | LAT | 17643 | 9183 | 0.001 | -0.4082 | No | ||
| 18 | PLCG1 | 14753 | 9774 | -0.001 | -0.4399 | No | ||
| 19 | SOS1 | 5476 | 10751 | -0.003 | -0.4922 | No | ||
| 20 | ARHGAP5 | 4412 8625 | 11027 | -0.004 | -0.5068 | No | ||
| 21 | TRB@ | 1157 | 11555 | -0.005 | -0.5348 | No | ||
| 22 | PIK3R1 | 3170 | 11690 | -0.006 | -0.5417 | No | ||
| 23 | ARHGAP6 | 24207 | 12924 | -0.011 | -0.6073 | No | ||
| 24 | PIK3CA | 9562 | 13925 | -0.021 | -0.6598 | No | ||
| 25 | FYN | 3375 3395 20052 | 15046 | -0.049 | -0.7170 | No | ||
| 26 | PTPRC | 5327 9662 | 15455 | -0.074 | -0.7343 | No | ||
| 27 | ARFGAP3 | 22183 | 16364 | -0.221 | -0.7691 | Yes | ||
| 28 | RAF1 | 17035 | 16474 | -0.248 | -0.7592 | Yes | ||
| 29 | ARFGAP1 | 14705 2854 | 16614 | -0.290 | -0.7482 | Yes | ||
| 30 | ARHGAP1 | 6001 10448 | 16885 | -0.388 | -0.7380 | Yes | ||
| 31 | GRB2 | 20149 | 16888 | -0.389 | -0.7133 | Yes | ||
| 32 | PPP3CB | 5285 | 16962 | -0.419 | -0.6906 | Yes | ||
| 33 | MAPK3 | 6458 11170 | 17011 | -0.437 | -0.6654 | Yes | ||
| 34 | RAC1 | 16302 | 17052 | -0.451 | -0.6388 | Yes | ||
| 35 | PPP3CC | 21763 | 17176 | -0.498 | -0.6136 | Yes | ||
| 36 | MAP2K4 | 20405 | 17227 | -0.515 | -0.5835 | Yes | ||
| 37 | PRKCA | 20174 | 17237 | -0.520 | -0.5508 | Yes | ||
| 38 | RELA | 23783 | 17583 | -0.705 | -0.5245 | Yes | ||
| 39 | JUN | 15832 | 17701 | -0.791 | -0.4804 | Yes | ||
| 40 | ARHGAP4 | 9343 | 17817 | -0.882 | -0.4304 | Yes | ||
| 41 | VAV1 | 23173 | 17823 | -0.886 | -0.3743 | Yes | ||
| 42 | NFKBIA | 21065 | 18048 | -1.142 | -0.3136 | Yes | ||
| 43 | MAP3K1 | 21348 | 18088 | -1.200 | -0.2392 | Yes | ||
| 44 | LCK | 15746 | 18240 | -1.451 | -0.1549 | Yes | ||
| 45 | NFATC1 | 23398 1999 5167 9455 1985 1957 | 18536 | -2.749 | 0.0043 | Yes |